
Foundations: Data, Data, Everywhere
In the modern world, data flows like an unseen current through every corner: sensors embedded in heavy machinery, digital time logs, material tracking systems, even wearable devices safeguarding worker health. When harnessed with purpose, this river of information becomes the bedrock upon which lean, intelligent projects are built. Engineers who see data as vital as steel and concrete craft not just structures, but living systems—agile, efficient, and continuously improving. Each measurement, whether of machine utilisation or supplier lead-time, offers a fragment of the greater mosaic. Together, they reveal the true health of a project, far beyond what the eye can see.
To embrace data is to accept that technology and field engineering are no longer separate crafts, but threads of the same tapestry. Modern sites are alive with digital tools—Building Information Modelling (BIM), IoT sensors, drones, and interconnected project platforms—all generating insights with each passing moment. A concrete sensor whispers of curing progress; a GPS trail maps the dance of machines across the earth; a finance sheet unmasks hidden accumulations of cost. Alone, each data point is a whisper. Together, they become a voice—a story the project tells those willing to listen. Through the lean lens, what once seemed like scattered noise becomes a clear and coherent narrative, guiding engineers to cut waste, add value, and breathe life into every beam and bolt they lay.
What is Data Analysis?
The process of systematically applying statistical and/or logical techniques to describe, condense, and recap, and evaluate data.
Ask Questions to Make Data-Driven Decisions
Before diving into numbers, ask the right questions. What problem are we trying to solve? Are we aiming to reduce costly rework, accelerate the schedule, or trim material waste? By framing clear, outcome-oriented questions, engineers ensure that data analysis will target real project challenges. For example, a site manager might wonder: “Which 20% of tasks lead to 80% of our delays?” or “Where is most of our material waste occurring?”
- Where is material waste highest on DesertBoard?
- Which phases or activities cause the most downtime on this project?
- What factors drive the largest portion of our cost overruns?
- Are equipment failures concentrated around specific machinery or conditions?
- Is there a link between work shifts and safety incidents?
- How does the weather correlate with daily productivity?
Each question guides the data collection and analysis plan. This approach aligns with Lean principles by forcing the team to focus on value-adding metrics. Rather than drowning in irrelevant details, a question-driven process channels the flood of data into meaningful insights. Focusing on questions keeps ECC Group aligned with Lean principles: eliminating waste, optimising flow, and delivering greater value to clients and stakeholders.
Prepare Data for Exploration
Once questions are set, gather and organise relevant data. Construction projects generate data from timesheets, budgets, inspections, machine logs, BIM models, and more. Preparing it means merging these varied sources into a unified, usable format—like aligning labour logs with equipment data, standardising units, and tagging records by phase or task.
Key steps include:
Collect data from sources like schedules, sensors, cost databases, and inventories.
Clean formats by aligning units, filling gaps, and correcting errors.
Categorise data by task, phase, or location.
Integrate into a single platform to avoid silos.
Remove irrelevant or outdated entries.
This structured approach helps engineers spot trends faster and ensures no critical data is overlooked.
Process Data from Dirty to Clean
Raw construction data is seldom flawless—duplicates and missing entries are quite common. Cleaning transforms this into reliable input. Common fixes include unifying date formats, correcting units, and filling in missing values.
Cleaning steps include:
Fix errors: typos, implausible numbers, and duplicates.
Fill gaps: use estimates or reference data when needed.
Normalise formats: standardise units and naming.
Cross-check with site experts.
Document all steps taken.
Clean data prevents analysis errors and supports lean workflows by avoiding rework. It’s the essential base for solid insights.
Analyse Data to Answer Questions (Using the 7 Quality Control (QC) Tools)
With clean, prepared data in hand, it’s time to turn numbers into knowledge. This stage addresses the specific questions posed at the outset using various analytic methods and the 7 QC tools, a core part of Lean and quality management practices. These tools help uncover patterns, identify root causes, and prioritise actions for improvement. For example, a Pareto Chart can rank defect types or delays by frequency or cost, revealing the “vital few” issues causing the most waste, illustrating the classic 80/20 principle.
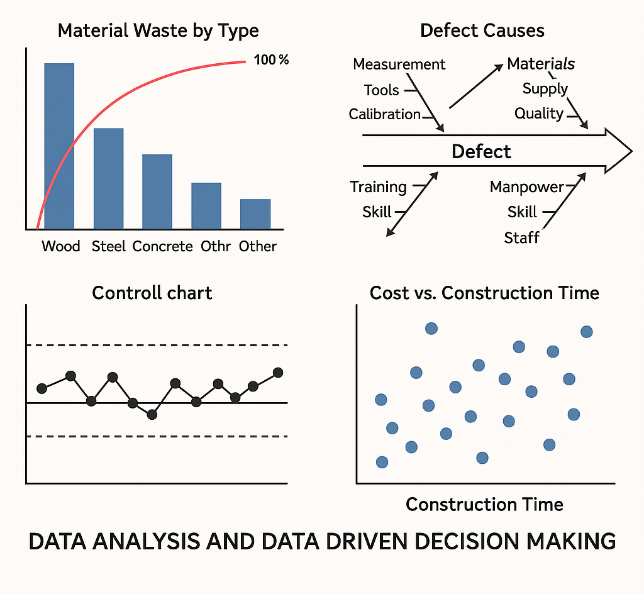
Here’s how several of the 7 QC Tools apply in construction analysis:
- Pareto Charts: Highlight top contributors to problems (e.g., delays or defects), helping teams focus on high-impact areas.
- Scatter Plots: Show relationships between variables, such as machine age vs. maintenance cost or crew size vs. productivity.
- Histograms: Reveal the distribution and variability of data like task durations or output volumes, identifying inconsistencies.
- Control Charts: Monitor stability of key processes over time, flagging unusual variations that need attention.
- Flow Charts: Map the steps of a process, helping identify inefficiencies or redundant steps.
- Check Sheets: Collect data in real time, often used for tracking defects, incidents, or occurrences.
- Cause-and-Effect (Fishbone) Diagrams: Organise possible root causes of a problem (e.g., frequent equipment failures) into categories for deeper analysis.
Additional tools like Line Charts, Heat Maps, and Bubble Charts can complement the 7 QC tools by offering more visual and multidimensional analysis.
Each tool answers a specific kind of question. A histogram might show one subcontractor consistently lags behind, while a scatter plot could expose a weather-related delay trend. This structured approach turns raw data into actionable insights. By focusing on key contributors, teams amplify their improvement impact, reducing delays, lowering costs, and eliminating waste. In one case, analysing and acting on top delay categories led to a significant schedule cut. Ultimately, these tools transform data into a targeted improvement roadmap.
How to Select the Right Tools for Analysis (7 QC Tools & Why)
The 7 Quality Control (QC) Tools are essential for root cause analysis, problem-solving, and continuous improvement. Selecting the right tool depends on the type of data, problem stage, and objective. Here’s a quick guide with a case study example:
Selection Criteria for 7 QC Tools:
| Tool | When to Use |
| Pareto Chart | To prioritize problems based on frequency or impact. |
| Cause & Effect | To prioritise problems based on frequency or impact. |
| Control Chart | To monitor process stability over time. |
| Check Sheet | To identify the root causes of a major problem. |
| Histogram | To collect and organise real-time data. |
| Scatter Diagram | To find relationships between two variables. |
| Flow Chart | To analyse the distribution of process data. |
Case Study: Reducing Defects in a Wood Panel Factory
Problem: High defect rates in final products.
Step 1: Use a Check Sheet
Operators record defects during the inspection (e.g., Scratch, Crack, Discolouration, etc.).
Step 2: Use a Pareto Chart (as shown in the image above)
The Pareto Chart shows that 80% of defects come from just two types: Scratches and Cracks.
Step 3: Use a Fishbone Diagram (Cause & Effect)
Investigate why scratches and cracks happen. Categories: Material, Machine, Method, Manpower.
Step 4: Use a Control Chart
Track if defect levels are stable over time or if special causes exist.
Share Data Through the Art of Visualisation
Insights without communication don’t lead to change. Visualisation transforms data into stories that drive action. In construction, clear charts or dashboards align teams and clarify priorities. A Pareto chart, for instance, instantly highlights major issues during meetings, focusing attention where it matters.
Effective visualisation relies on:
- Clarity: Use clean labels, simple colours, and highlight key info (e.g., top Pareto bars).
- Relevance: Choose the right chart for the question—Pareto for top issues, scatter for relationships, line for trends.
- Context: Add units, time frames, baselines, or targets to avoid misinterpretation.
- Action Focus: Add notes, findings, or recommendations directly to visuals.
- Accessibility: Share dashboards, post charts, and use interactive tools like Power BI to build a data-driven culture.
Well-designed visuals spark action, align teams, and build credibility by making insights visible and actionable.
Turning Numbers into Actions: Building Action Plans
Data must lead to change. Once the analysis is done, the focus shifts to action.
Steps to turn data into impact:
- Define Ownership: Assign people to lead actions (e.g., reduce downtime by 15%).
- Set Targets: Use KPIs—like boosting on-time delivery or cutting rework.
- Prioritise: Focus on the few issues causing most of the losses (Pareto logic).
- Plan Resources: Align training, maintenance, or other tasks with calendars.
- Review Often: Track progress monthly and adapt based on results.
With clear, measurable actions, ECC Group turns insights into continuous operational improvement.
In the end, integrating these steps creates a robust, data-informed culture on every construction project. Lean methodology and data analytics are natural allies: both emphasise efficiency, evidence, and continuous improvement. By laying a digital foundation and following the path from questions to clean data, analysis, and clear visuals, engineers build a stronger project framework. This data-driven blueprint leads to smoother schedules, tighter budgets, and minimised waste. It also means safer sites and more predictable outcomes. Embracing data-driven decision-making empowers engineers to build not just structures, but lasting value. By mastering the full data cycle—from capturing factory-floor machine usage at Abanos to optimising supplier lead times for ECC Contracting’s landmark projects—we build more than structures: we build resilience, efficiency, and excellence. Data-driven decisions are no longer optional. At ECC Group, they are part of our DNA.